Current filter:
Published: 8 February 2019
Hawke’s Bay Regional Council’s monthly public climate briefing in Napier this week focused on the wetter than normal summer.
River and groundwater levels on the Heretaunga Plains and Ruataniwha Plains have recovered after the dry October, which saw only half its normal rainfall, and remained at normal or above normal levels since December.
“It’s an unusually positive position for the region to be in, and growers and processors have had some relief this summer from normal stressful climate conditions ,” said Dr Stephen Swabey, HBRC Science Manager.
HBRC’s air quality scientist Dr Kathleen Kozyniak said “The expected switch to El Niño hasn’t happened so the climate is still in a neutral phase. The sea surface around New Zealand is warm so that is having the most influence on our weather, and the easterly and north-easterly winds we’ve had in recent months have been warmer coming off the sea.”
She says that NIWA’s forecast to April is for temperatures to be above average and rainfall near normal. There is a chance of tropical cyclones moving down and affecting the east coast.
This summer soil moisture levels have been up, with most of the regional council’s monitoring indicating they are well above where they typically sit at this time of year.
Groundwater levels in the Heretaunga Plains and Ruataniwha Plans aquifers too have been comparatively high since November. (see slides below). The council’s monitoring has also picked up where pumping from some bores ceased over December, which is unusual compared to previous summers.
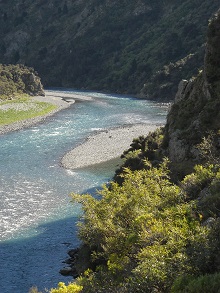
River flows across the region have been mostly above normal or in the near normal range. The NIWA climate outlook forecasts river flows to be near normal through to April.
The Regional Council science team now also reports on water use in the region, as a high level of water metering and reporting is available through consents monitoring. This reporting includes water use by industry, irrigation, and domestic supply. Across Hawke’s Bay, December’s overall water use was the lowest since 2012 and October’s water use was the highest since 2012. The Tukituki catchment showed these extremes the most. (see chart below)
Similarly on the Heretaunga Plains, October’s water use was the highest since 2012, but December’s was the lowest since 2012.
The regional council’s website now displays graphics of river and groundwater levels which provide water users with a quick way to check a map showing whether rivers are rising or falling, as well as more detailed data on a weekly, monthly or annual basis.
 |
 |
 |
+64 6 835 9200
159 Dalton Street. Napier 4110
Private Bag 6006, Napier 4142
Disclaimers, Copyright & Privacy
![]()
Disclaimers and Copyright
While every endeavour has been taken by the Hawke's Bay Regional Council to ensure that the information on this website is
accurate and up to date, Hawke's Bay Regional Council shall not be liable for any loss suffered through the use, directly or indirectly, of information on this website. Information contained has been assembled in good faith.
Some of the information available in this site is from the New Zealand Public domain and supplied by relevant
government agencies. Hawke's Bay Regional Council cannot accept any liability for its accuracy or content.
Portions of the information and material on this site, including data, pages, documents, online
graphics and images are protected by copyright, unless specifically notified to the contrary. Externally sourced
information or material is copyright to the respective provider.
© Hawke's Bay Regional Council - www.hbrc.govt.nz / +64 6 835 9200 / info@hbrc.govt.nz